📊 National Overview
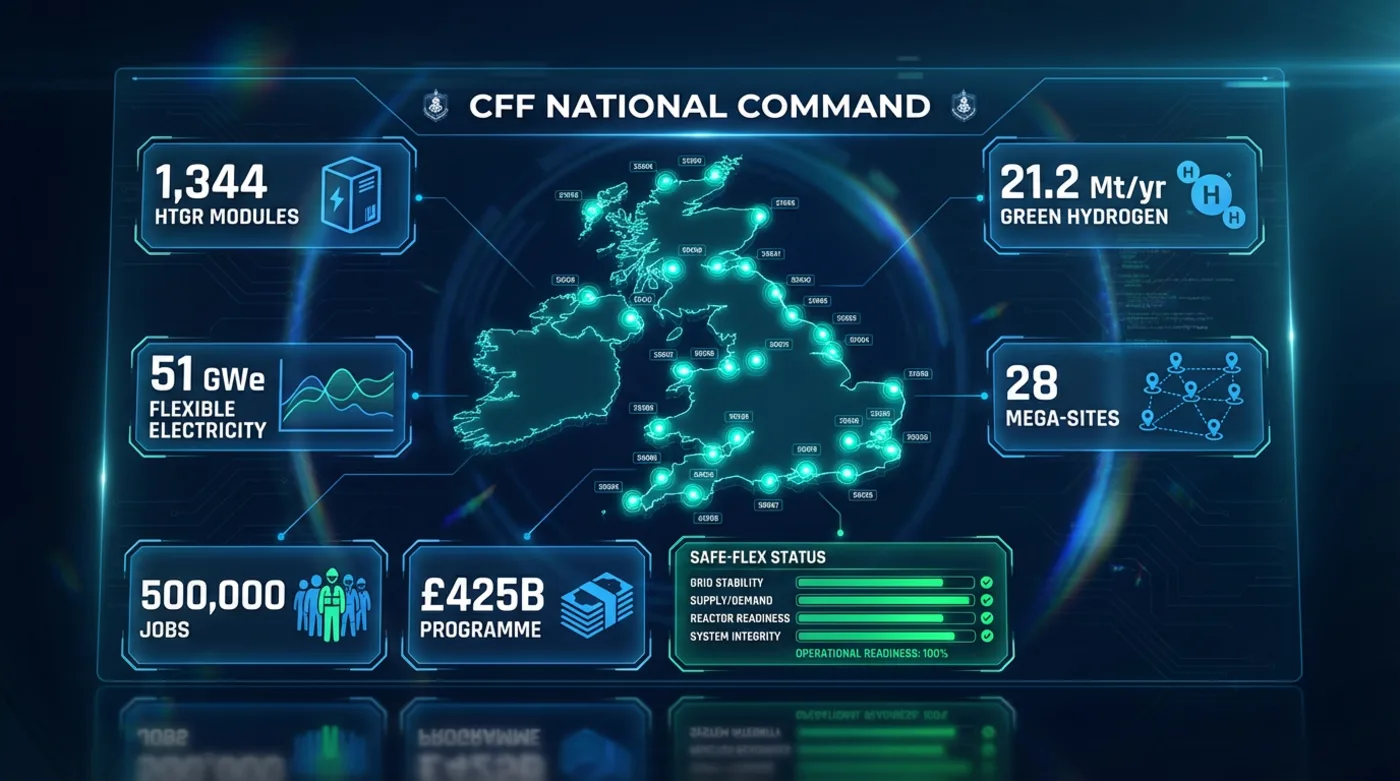
CFF National Dashboard: 28 Mega-Sites, 11 Regions
28 coastal mega-sites across 11 UK regions — delivering firm power, green hydrogen, desalinated water, and district heating across Britain.
⚡ Safe-Flex Mode — Dunkelflaute Response
Under normal operation, all 3.6 GWe per site powers hydrogen production. When renewables fail, Safe-Flex can ramp HTSE down by 1–50% on any combination of the 28 sites — freeing up to 1.8 GW per site (~50 GW nationally) for the grid, while hydrogen production continues:
Select a Region to Explore
All Regions at a Glance
| Region | Sites | GW | Jobs | Heat Halo Reach | H₂ t/day | Regional Impact | Key Industry | |
|---|---|---|---|---|---|---|---|---|
| 🏴 Scotland | 4 | 14.48 | 72,000 | 1,120,000 | 8,288 | Sovereign benefit | Green Hydrogen Export + Offshore Wind Integration | |
| ⚓ North East England | 3 | 10.86 | 54,000 | 840,000 | 6,216 | Sovereign benefit | Steel & Chemical Decarbonisation + Port Hydrogen Hub | |
| 🌹 Yorkshire & Humber | 3 | 10.86 | 54,000 | 840,000 | 6,216 | Sovereign benefit | Humber Industrial Cluster + H₂ Pipeline Hub | |
| 🐝 North West England | 3 | 10.86 | 54,000 | 840,000 | 6,216 | Sovereign benefit | Chemical Industry + Port Decarbonisation + Digital Economy | |
| 🐉 Wales | 3 | 10.86 | 54,000 | 840,000 | 6,216 | Sovereign benefit | Steel Decarbonisation + Tidal Integration + Rural Energy | |
| 🌊 South West England | 3 | 10.86 | 54,000 | 840,000 | 6,216 | Sovereign benefit | Maritime Hydrogen + Tourism Economy + Aerospace | |
| 🏙️ London & South East | 3 | 10.86 | 54,000 | 840,000 | 6,216 | Sovereign benefit | Finance + Heathrow + Port of London | |
| 🌾 East Anglia | 3 | 10.86 | 54,000 | 840,000 | 6,216 | Sovereign benefit | Agri-Food + Offshore Wind Integration + Port Logistics | |
| 🏭 East Midlands | 1 | 3.62 | 18,000 | 280,000 | 2,072 | Sovereign benefit | Aerospace + Logistics + Food Manufacturing | |
| 🚗 West Midlands | 1 | 3.62 | 18,000 | 280,000 | 2,072 | Sovereign benefit | Automotive + Advanced Manufacturing | |
| ☘️ Northern Ireland | 1 | 3.62 | 18,000 | 280,000 | 2,072 | Sovereign benefit | Cross-Border Energy + Agri-Food + Maritime |
About the CFF National Dashboard
The Carbon Free Future National Dashboard maps the full programme across 28 coastal mega-sites and 11 UK regions. At full build-out, the fleet delivers 101.3 GWe of flexible electricity, 58,016 tonnes of green hydrogen per day, 1.4 million cubic metres of desalinated water per day, and district heating for approximately 7.84 million homes — all from a single unified national infrastructure owned and operated by the British state.
Each of the 11 regions receives a tailored allocation of sites based on coastal access, industrial need, and population. Scotland hosts 4 sites producing 14.48 GW and 8,288 tonnes of hydrogen per day, supporting green hydrogen export and offshore wind integration. The North East of England hosts 3 sites producing 10.86 GW, with a focus on steel and chemical decarbonisation and port hydrogen hubs. Yorkshire and the Humber, the North West, Wales, the South West, London and the South East, and East Anglia each host 3 sites producing 10.86 GW. The East Midlands, West Midlands, and Northern Ireland each host 1 site producing 3.62 GW.
Across all 28 sites, the programme creates approximately 500,000 permanent skilled jobs — 18,000 per site — covering construction, reactor module maintenance, hydrogen and desalination operations, power distribution, and site management. These roles are designed to last the full 200-year operational life of the infrastructure, with each generation of workers transitioning into the next generation of reactor module replacements.
The Safe-Flex grid backup capability shown in the dashboard represents up to 50.4 GW of firm zero-carbon electricity that can be released to the national grid within seconds during renewable shortfalls. Under normal operation, all electrical output from each site's 48 HTGR modules is consumed on-site for hydrogen production. When demand requires it, operators can reduce HTSE load across any combination of sites, freeing that capacity for the grid while hydrogen production continues at a reduced rate.
The dashboard data is drawn from the full programme specification. Regional breakdowns, site counts, job figures, hydrogen output, and heating reach are all derived from the core engineering parameters described in the Energy Strategy and Delivery Plan pages.